The Normal Distribution
Properties of Normal Distributions
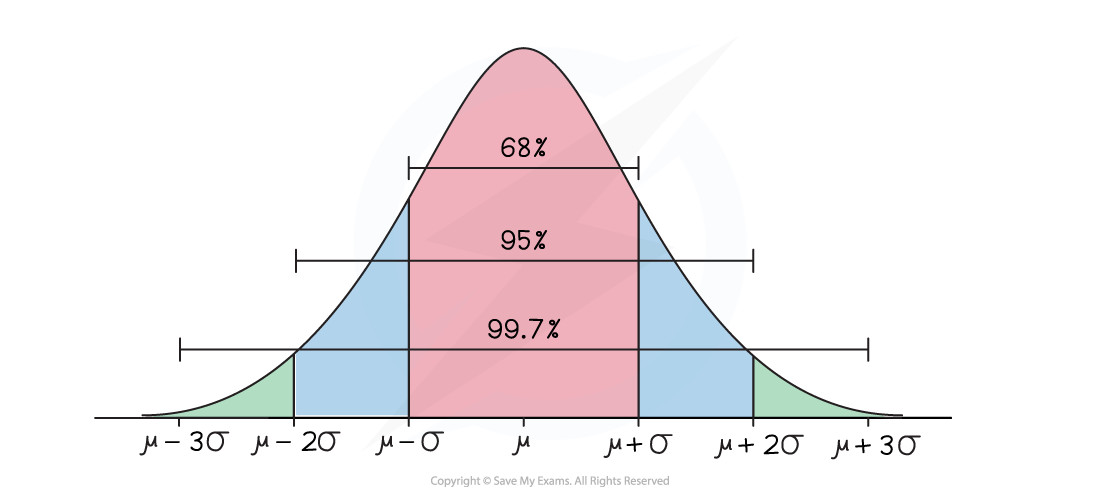
Empirical Rules
- 68% of the data lies within one standard deviation of the mean
- 95% of the data lies within two standard deviations of the mean
- 99.7% of the data lies within three standard deviations of the mean
What Can Be Modeled Using A Normal Distribution
- The variable is roughly symmetrical with only one mode
- X can take any real value
- Values far from the mean (more than 4 standard deviations away) have a probability density of practically zero
What Cannot Be Modeled Using A Normal Distribution
- More than one mode or no mode
- Not symmetrical
- Variables in which acceptable ranges of values () become negative when they are meant to be positive
Standardized Z-Scores
- Standard Normal Distribution: a normal distribution where mean is 0 and standard deviation is 1. Denoted by .
- Any normal distribution can be transformed to the standard normal distribution curve by a horizontal translation and a horizontal stretch
- , where is a normal distribution with mean and standard deviation
- Standard Normal Table: z-score → possibility
Comparing Normal Distributions
Two can be compared by examinating their and

Comparing -Scores
- -score indicates the number of that a data lies from the of its distribution
- The data point with greater -score lies furthur from the
Inverse Normal Calculations
P(X < a) value
- Find the cell in the standard normal table P(X<a)
- Get z-score
- Convert z-score back to the actual value
P(X > b) value
- Get P(X < b) = 1 - P(X > b)
- Find the cell in the standard normal table P(X > b)
- Get z-score
- Convert z-score back to the actual value
Notice, when getting the cell, choose the one that is closest while within the limit.