Inference for Means
t-Distribution
What Is t-Distribution
A continuous probability distribution similar to the normal distribution
- The tails are thicker more chances of getting extreme values
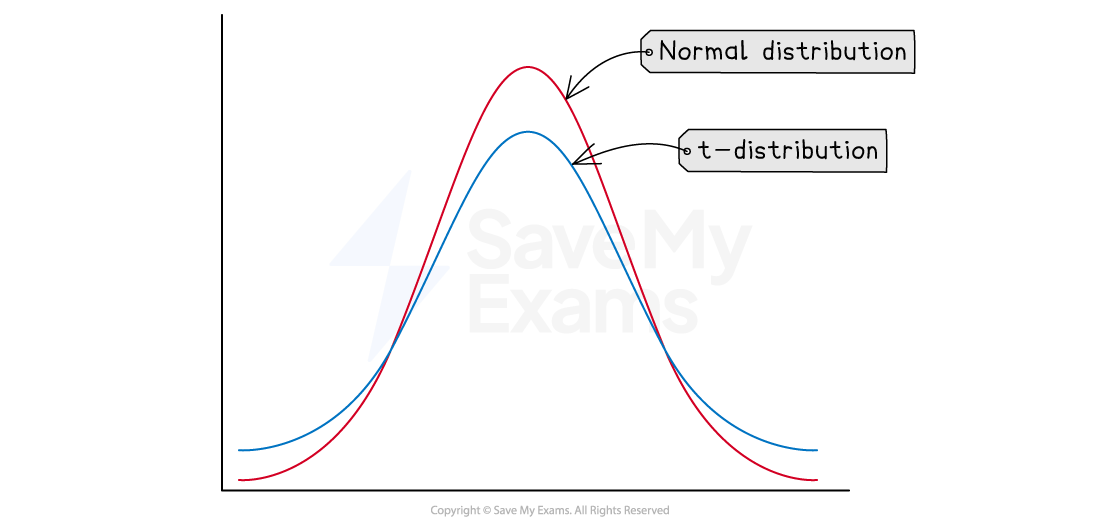
- Degrees of freedom, dof
- dof peak sharper and tails thinner closer to normal distribution
- , closer to 1 as dof increases
When Is t-Distribution Used
- is unknown and population is approximately normally distributed
- t-distribution can be used to
- Perform hypothesis tests for
- Form confidence intervals for
Hypothesis Tests for Population Means
One-Sample t-test for Mean
Test whether the population mean of a normally distributed population has changed
is unknown
Conditions for One-Sample t-test
- If the population is very skewed, a t-test can only be done when
Calculate t-value
Calculate dof
- , if there are multiple , choose the smallest one.
For Differences in Population
t-scores VS z-scores
graph LR;

H(Start);
I{Normally distributed?};
H --> I;
I -->|Yes| G;
I -->|No| F;
G{Population variance known?};
G -->|Yes| B(z-score);
G -->|No| C{n < 30?};
C -->|Yes| D(t-score);
C -->|No| B;

F{n ≥ 30?} -->|"Yes (CLT)"| B;
F -->|No| J(Non-parametric tests);
Paired t-test
Test whether or not the population means of two pieces of data that are linked are equal by examining the differences between paired data
- The data for a two-sample t-test is from two independent populations
-
The data for a paired t-test is linked and come from one population
-
Use for the difference of two measures. For instance,
Calculate t-value